FIND ANYTHING IN GOOGLE SEARCH BAR

Tuesday 8 November 2022

Breakout with Volume -Lemon Tree Hotel

Lemon Tree Hotels Limited is India’s largest hotel chain in the mid-priced hotel sector, and the third largest overall. THL currently operates ~8,400 rooms in 87 hotels around 52 destinations, in India and out of India. Their brands are Aurika Hotels & Resorts, Lemon Tree Premier, Lemon Tree Hotels, Red Fox Hotels, Keys Prima, Keys Select and Keys Lite. As the current pipeline becomes operational, LTHL will be operating ~10,450 rooms in 106 hotels across 64 destinations, in India and abroad.

 The Leon Tree providing best-in-class cost structure, both in building and operating hotels. In an attempt to offer the best Return on Capital Employed to investors, over the long term.

Technically the stocks looks promising in short term. we recommend to buy this stocks  within range  93-96  with target 103 considering support  Support  87-81. Live Chart


Monday 31 October 2022

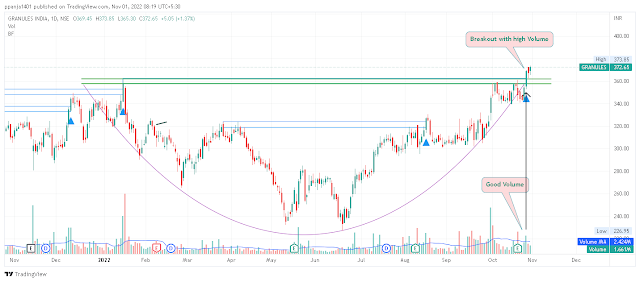
Granules India-A Potential breakout Candidate in Pharma Manufacturing Sector

Why Granules India a must Buy ?

Granules India and its subsidiaries are a vertically integrated, high-growth pharmaceutical company with 38 years of proven track record and increasing presence across the globe. Granules offers collaborative and strategic partnership to global pharmaceutical leaders by manufacturing and selling of Active Pharma Ingredients (APIs), Pharmaceutical Formulation Intermediates (PFIs) and Finished Dosages


Market Cap₹ 9,255 Cr.          Current Price₹ 373             Face Value-₹ 1.00


High / Low- ₹ 374 / 227=1.65 --  <2.2 is Good

Stock -P/E 19.1   < Industry 24.3 P/E is Good.
P/E ratio is the most widely used parameter to analyze whether the stock of any company is overvalued or undervalued at any point in time. It is calculated by dividing the current market price (CMP) of stock by profit/earnings per share (EPS).

Dividend Yield-0.40 %    > 0 is Good, Higher is better
A financial ratio that shows how much a company pays out in dividends each year relative to its share price. The dividend yield is calculated as annual dividends per share divided by market price per share.

ROCE-17.4 %  -  ROE-17.5 %      > 10% is Good,
Also called Return on net worth, it measures a company’s profitability by revealing how much profit a company generates with the money shareholders have invested, it is calculated by dividing the net profit after tax by shareholder's fund For high growth companies you should expect a higher ROE.


Current ratio-1.35   > 1.25 is Good, 
A liquidity ratio that measures a company's ability to pay short-term obligations. The higher the current ratio, the more capable the company is of paying its obligations.

Quick ratio-0.78   > 1 is Good,
The quick ratio measures a company's ability to meet its short-term obligations with its most liquid assets. For this reason, the ratio excludes inventories from current assets


Sales growth-24.1 %   -CAGR >15% for last 7-10 years
Growth should be a consistent year on year. Ignore companies where a sudden spurt of sales in one year is confounding the 10 years performance.Very high growth rates of >50% are unsustainable.


Price to Sales-2.21   < 1.5 is Good--James O’Shaughnessy: Buy if P/S ratio is < 1.5 and sell if >3
Price to book value-3.56  For a Good Company -  3 – 6 is Ok &< 4 is very good
A stock is termed as undervalued if it has a lower P/B ratio. A low P/B ratio may also mean a company has some problems with its fundamentals.

Return on assets-10.1 %     > 5% is Good, < 5% is Not Good.
An indicator of how efficient management is at using its assets to generate earnings. Calculated by dividing a company’s annual earnings by its total assets

CF Operations₹ 332 Cr. - CFO>0 -   Positive CFO necessary

NPM last year-11.1 %  >8 is Good--
Look for companies with sustained operating profit & net profit margins over the years

PEG Ratio-0.93  <1 is Good
The price/earnings to growth ratio (PEG ratio) is a stock's price-to-earnings (P/E) ratio divided by the growth rate of its earnings for a specified time period. The PEG ratio is used to determine a stock's value while taking the company's earnings growth into account and is considered to provide a more complete picture than the P/E ratio.

Int Coverage-21.6 > 2 is Good,(For Banks & NBFC this is not Valid)

It is used to determine how easily a company can pay interest on outstanding debt. It is calculated by dividing a company's EBIT by the interest expenses.


Debt to equity-0.41--< 1 is Good,
(For Banks & NBFC this is not Valid)
A measure of a company's financial leverage calculated by dividing its total liabilities by stockholders equity. The debt/equity ratio also depends on the industry in which the company operates.

Promoter holding-41.9 %--> 30% (Must for Promoter)
Higher the better
 
Technical View


Technically Granules India able to Breakout Above strong resistance @362. 
BUY  at this range with Target 500 near term with stop loss 355


Saturday 9 April 2022

UFLEX: STRONG UPMOVE JOURNEY POSSIBLE

UFLEX(CMP-678)  starts correction OCT'21 & consolidate FROM NOV'21 TO 7TH MAR'22. Last week was able to break out with good volume START TO BUY AT THIS LEVEL & DIPS UP UP TO 660 WITH SL 620 TARGET 840.


PRICE TRADES AVOVE IMPORTANT MOVING AVERAGES AS SHOWN BELOW:


Saturday 2 April 2022

Technical Buy of Action Construction

Action Construction Equipment(CMP:235)

Action Construction Equipment (ACE) Company was promoted by Vijay Agarwal and his wife Mona Agarwal. ace are market leaders in Mobile Cranes & Tower Cranes segment. In addition to Mobile Cranes, ACE also offers Mobile/Fixed Tower Cranes, Crawler Cranes, Truck Mounted Cranes, Lorry Loaders, Backhoe Loaders, Vibratory Rollers, Piling Rigs, Forklifts, Warehousing Equipment, Tractors, Harvesters, and other Agri Machinery.

RECENT PERFORMANCE SUMMARY

Return on Equity has increased versus last 3 years average to 17.10%

 Net Profit is growing at healthy rate in last 3 years 15.17%

 Sales growth is good in last 4 quarters at 77.96%

Technical Outlook :

The stock trading above all moving average like :

Exponential Moving Average (10)

224.18

Simple Moving Average (10)

221.47

Exponential Moving Average (20)

221.08

Simple Moving Average (20)

218.16

Exponential Moving Average (30)

220.48

Simple Moving Average (30)

218.56

Exponential Moving Average (50)

221.15

Simple Moving Average (50)

220.48

Exponential Moving Average (100)

223.25

Simple Moving Average (100)

223.46

Exponential Moving Average (200)

215.19

Simple Moving Average (200)

232.53

Ichimoku Base Line (9, 26, 52, 26)

221.33

Volume Weighted Moving Average (20)

223.35

Hull Moving Average (9)

233.38


After consolidation in Symmetrical Triangle from 15 June'21, Ace on 31/3/22 successfully attempted to breakout above the downtrend line.
Indicators like RSI, Macd, CCI, and ADX are Bullish zone.
Investors & Traders may invest above this level & dips up to Rs. 210 keeping a target of Rs.330 shortly with Stop Loss-200.

Sunday 9 January 2022

Technical Breakout Buy of Rain Industries

Rain Industries Limited(Cmp-Rs.244.80)

Rain Industries Limited (RAIN) is a leading vertically integrated producer of calcined petroleum coke, coal tar pitch, and other high-quality basic and specialty chemicals.  Headquartered in India, RAIN has manufacturing facilities in eight countries across three continents. The group continues to grow through capacity expansions and mergers and acquisitions across the world. RAIN operates in three key business verticals: carbon, chemicals, and cement.

This Stock shows strength for the last couple of days & able to Triangle Pattern breakout with good volume above Rs.240.If the Price is able to sustain above this level, the Short to medium-term target will be Rs 320 & for the long term Rs.500


Investors and traders may buy this stock following these important levels:

Cmp-Rs.244.80
Support-230-221-200
Resistance:258,272,300,408

Short-term traders may use Sl at Rs. 230

Happy investing for the Year 2022