
Wednesday, 1 December 2021
TECHNICAL BUY OF THIS PHARMA PLAYER- Dishman Carbogen Amcis Ltd:
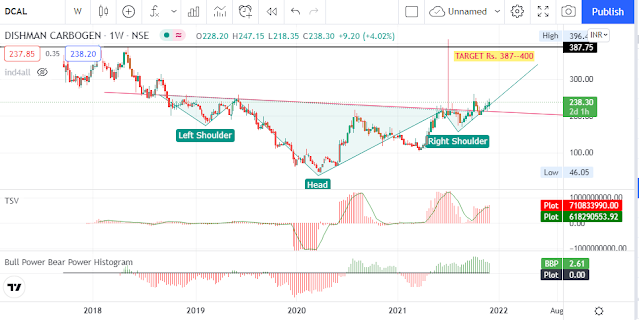
Dishman Carbogen Amcis Ltd is a fully integrated CRAMS player working with global pharmaceutical innovators, has a global presence with development and manufacturing facilities across Europe, India, and China. We provide end-to-end, integrated, high-value, niche CRAMS offering, right from process research and development to late-stage clinical and commercial manufacturing facilities along with the supply of Active Pharmaceutical Ingredients (API) to innovator pharmaceutical companies.
In the weekly chart, this stock breaks out above Rs.213 forming an Inverted Head and Shoulder. Buy at CMP-237 with target-400 within one year maintaining the stop loss 200
Friday, 1 October 2021
RALLIS INDIA REVIEW FOR BUYING
RALLIS INDIA
After Recoomendtion on 9/01/2021 @Rs 302, Rallis India touched Rs.362.60.forming a recent top. Then undergoes correction confirming an uptrend channel. Now after bottoming out starts the upward journey for targeting Rs. 360. The double RED line at Rs. 270-300 is very strong support which was Resistance from the Year 2015. So above 360-365. A new upward journey will be started targeting 490.

In this weekly chart, RSI takes support from 40 levels. Macd stars converging for a bullish crossover.ADX(DMI) Bullish blue line(DI+) ready to go upside again after touch & kiss yellow line(DI-) which provides more confidence for rising up of price.
Saturday, 11 September 2021
Most Undervalued Electrical Vehicle Related Stock for Future Multibagger
Amara Raja Batteries Ltd(NSE: AMARAJABAT) CMP-Rs.721

FAIR/INTRINSIC VALUE OF AMARA RAJA BATTERIES

Weekly RSI Now 41.5 & return from level 30. MACD converged fully & ready to cross the signal line(Redline). So Investors Must take a look to buy this gems stock Keeping stop loss @ 650.
Amara Raja Batteries (ARBL), the flagship company of the Amara
Raja Group is a leading manufacturer of automotive batteries under the brands
- Amaron and PowerZone
In India, Amara Raja is the preferred supplier to major
telecom service providers, Telecom equipment manufacturers, UPS sector (OEM
& Replacement), Indian Railways and to Power, Oil & Gas, Passenger
Vehicles, Three Wheelers, Two Wheelers, Commercial Vehicles, Farm Vehicles,
Inverters. Additionally, Amara Raja Industrial Batteries offers a wide scope of
battery arrangements in portions like UPS, Telecom, Railways, Defense, and
Motive.
Most investors are disappointed who already stay invested in Electrical vehicle-related Stocks in perception for EV Boom but fruits are not riped till now. But remember this is high time to invest in Electrical vehicle-related Stocks. I have found out this very strong potential and undervalued growth stock which is fundamentally very strong for its consistent growth potential
Financial Health
-: Previous year & Future Sales And Profit Growth Estimation:-
Ø Amara Raja Batteries Ltd's earnings have grown
by 5.5%, whereas share price has declined -6.6% CAGR over the past five years,
indicating the company’s share price is likely undervalued.
Ø Amara Raja Batteries Ltd share price has
appreciated 20.3% annually (CAGR) over the past ten years.
Ø Amara Raja Batteries and Exide Industries each
have 30% market share in this industry in India
Ø Amara Raja Batteries already has a foreign
partner. Johnson Controls holds a 26% stake in the company. Johnson Controls has
the uniqueness to provide technical support and gain a stake in the company.
What is the Intrinsic Value of AMARA RAJA BATTERIES?
As of 09-Sep-2021, the Intrinsic Value of AMARA RAJA
BATTERIES is Rs. 989.31 determined based on Median of the 3
historical models.
Fair Value [Median EV / EBIDTA Model] : Rs. 952.80
Fair Value [Median EV / Sales Model] : Rs. 1,016.93
Fair Value [Median Price / Sales Model] : Rs. 989.31
Median Fair Value of AMARA RAJA BATTERIES: Rs. 989.31
As of 09-Sep-2021, AMARA RAJA BATTERIES is trading at a
Discount of -27% based on the estimates of Median Intrinsic Value!
Technical Analysis

In the weekly chart, Price confluence at Rs. 683, which is very good support & price follows a downtrend channel & tries to break this trend channel to go upside. If price sustains above Rs. 730.
6th UP TARGET 2111.46 5th UP TARGET 1730.62 4th UP TARGET 1495.21 3rd UP TARGET 1259.81 2nD UP TARGET 1125.00 1sT. UP TARGET 1020.00
Thanking you for visiting the site & stay tuned for future updates subscribing blog free of cost.
“Investing should be more like watching paint
dry or watching grass grow. If you want excitement, take $800 and go to Las
Vegas.” – By Paul Samuelson
Saturday, 17 April 2021
Technical Buy Wipro Limited
Buy IT Giant Wipro Limited for multi fold Return(CMP-469.20)

Support Level are 450/430/400
Saturday, 10 April 2021
Bhansali Engineering-A Technically Bullish Stock
Bhansali Engineering is Ready to Huge Up move(CMP-163.80)

On daily chart Bhansali Engineering has formed an ideal symmetrical Triangle.On 7/4/21 price just cross downtrend resistance line .If price sustains above Rs.160.It would be a good opportunity to buy this Bullish trending stock Targeting Rs.230 Short to medium term keeping Stop loss Rs.153.
Happy investing.
Saturday, 3 April 2021
TECHNICAL TALK OF BULLISH BREAKOUT STOCKS
KANCHI KAPOORAM LIMITED(CMP Rs. 818)

Sunday, 7 February 2021
Which is The No 1 FMCG Company In India ?
Our Everyday life is solely dependent on FMCG (Fast Moving Consumer Goods) products from morning to night.This Sector is the India's fourth largest sector & engaged 3.2 million people directly or indirectly.The demand of FMCG products are growing rapidly.Due to low cost & very fast consumption, FMCG products are produced in large volume. This sectors basically covers Processed foods, Drinks,Beverages,Personal care products,Medicines,Cleaning Products,Toiletries,Office Supplies
Today we have done detailed fundamental comparison of top 6 FMCG Companies in India. This companion is based on Quality & Valuation.
Comparison Of 6 good FMCG Companies by Fundamental Analysis.
Companies selected for analysis
1) GODREJCP 2) MARICO 3) HINDUNILVR
4) DABUR 5) ITC 6) TATA CONSUMER
Process Of Analysis & Understanding of Rank & Score considering Quality & Valuation
A) Comparison considering Quality
Here , 1 means that the company
has scored lowest points and 5 means the company has scored highest points.


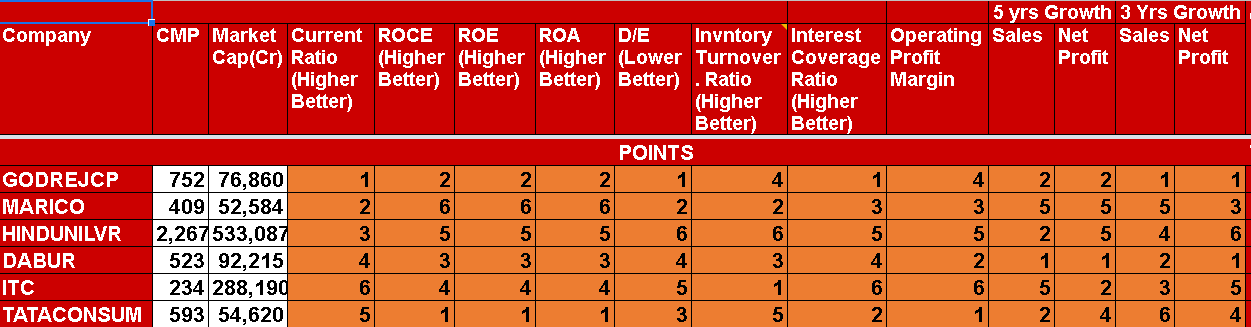
Here we have analysed considering ten matrices as below :
1) Current Ratio 2) Return on Capital Employed(ROCE)
3) Return on Equity (ROE) 4) Retun on Asset (ROA)
5) Debt to Equity Ratio(D/E) 6) Inventory Turnover Ratio
7) Interest Coverage Ratio 8) Operating Profit Margin
9) 5 year sales & Profit Growth 10) 5 year sales & Profit Growth
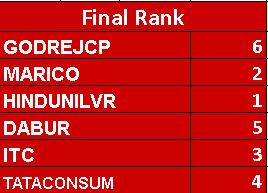
Comparing the quality aspects HINDUNILVR is Ranked One & GODREJ CONSUMER Is Ranked Sixth.
A) Comparison considering Valuation


Here we have valued Stock Price((Highest(6) to Lowest(1)) considering ten matrices as below :
1) Price/ Earning to Earnings Growth Ratio(PEG Ratio) 2) Price to sales Ratio (P/S ratio)
3) Price to Book Value (P/B Ratio) 4) Price/ Earning (PE Ratio)
5) Dividend Yield (D/Y ratio) 6) EV/EBITDA Ratio(Lower Better)
7)EV/Sales Ratio 8) PEXPB (Lower Better)
9) Price to free Cash Flow (Price /FCF) 10) Price To Graham No(lower Better)
Comparing the Valuation aspects ITC is Ranked One (Cheapest Price) & DABUR is Ranked Sixth (High price).
Please note that this is not any buy and sell recommendation
, only a comparative study for education purpose only.
Sunday, 17 January 2021
Technical & Fundamental View Of FMCG Major ITC

ITC has diversified product portfolio in Branded Packaged
Foods, Personal Care, Education and Stationery, Agarbattis & Safety
Matches, Lifestyle Retailing, Cigarettes & Cigars, Hotels, Paperboards
& Specialty Papers, Packaging, Agri-business & IT.
ITC seeks to be emerge as an engine of growth in the Indian
economy through a vibrant portfolio of future-ready businesses that are well
poised to serve the emerging needs of future
market. The synergies between ITC’s diverse businesses lend competitive
strength to each other. ITC aspires to be a leader in every business segment
that it operates in, whilst creating sustained value for all stakeholders.
ITC has made tremendous effort to decrease its dependence on
cigarette business. It has been successfully able to mobilise all its funds
generated from the business of Tobacco, in other fast-growing sectors like
FMCG, Agri- products, and hospitality chains.
-:Fundamental Analysis :- -:Company Snapshot & Brand Strength :-


1) Runs 13 Business in 5 Segments.
2) Over 60 New Products launched in 1919-1920
3) ITC exports 90 Countries
4) 40 lacks farmers are involved
5) ITC’s FMCG products are available in 60
lacs retail outlets.
lacs retail outlets.
6) ITC’s FMCG products are available in 6
million retail outlets
million retail outlets
7) Aashirvaad is No. 1 in branded Atta
8) Bingo! Is No. 1 in Bridges segment of Snack
Foods (No.2 overall in Snacks &
Potato
Chips)
9) Sunfeast is No. 1 in Cream Biscuits
10) Classmate is No. 1 in Notebooks
11) YiPPee! is No. 2 in Noodles.
12) Fiama is No.2 in Body Wash
13) Mangaldeep is No. 2 in Agarbattis (No. 1 in Dhoop segment)
-:Financial Health:-
-:Sales &
Profit Growth:-

- Last 10 Years Compounded Sales Growth 10%
- Last 10 Years Compounded Profit Growth 14%
- Stock is providing a good dividend yield(4.66%)
- Company has been maintaining a healthy dividend payout
-:Free Cash Flow Trend Analysis:-
Free cash flow is the
money which has left over after it has paid for everything
it needs to continue operating—including buildings, Property, plant, equipment,
payroll, taxes, and inventory.It is also Called Owner's earnings.
Year - 2015 2016 2017 2018 2019 2020
FCF - 6543 Cr 7451 Cr 7505 Cr 10291 Cr 9414 Cr 12248 Cr
Over the last 5 years, ITC has maintained free cash flow growth has been 13.36%, vs industry average of 13.93%. This consistent growth of cash flow is very good for company as well as investors.Such cash flow indicates that company has robust potential to grow in future.

-:Liquidity Analysis:-
Over the last 5 years, ITC has maintained free cash flow
growth has been 13.36%, vs industry avg of 13.93%
Company has been maintaining a healthy dividend payout
Company is almost debt free (Debt to equity ratio-0.01)
Current Ratio-2.91 (>1.25 is Good)
Current Ratio-2 (>1 is Good)( The quick ratio measures a company's ability to meet its short-term obligations with its most liquid assets. For this reason, the ratio excludes inventories from current assets)
So Company has good Liquidity which help company to survive in adverse time also.
-:Profitability Analysis -

Company is consistently maintaining High Return Of Equity (ROE>15 Very Good) & High Return Of Capital Employed(ROCE>15% is Good) & Good ROA
-:Valuation -
- The Present Price to Earning Ratio(PE ratio) is 14.47 Which is lower than industry average 49.4
- EPS is steadily growing from Rs. 4.30 in 2011 to Rs. 12.31 in 2020
Conclusion : Analyzing all financial data, In respect of long term view ITC is a Very good investment bet & as per my view every investor must consider to include this dark horse in Portfolio.
Technical View

CMP of ITC is Rs. 217.85. ITC Recovers from March low low Rs.135 slowly following the uptrend Channel drawn red line.Now last 6 session price consolidate between Rs.200-220 & preparing to break out the channel.
The One interesting observation to be noted that Price mostly respects magic lines of green channel of 89 Moving Average, from very beginning of up journey .
In chart, 3 red arrows indicates efficient resistance by channel, 5 blue arrow shows good support zone.
In middle of June '2016 , green arrow shows that after breakout of green channel ,price steadily up move.
Now again that similar situation is arising if price able to cross the green channel & price sustain above Rs.225,don't miss the opportunity to buy for multibagger return .
Another notable observation is that from January'20 , significant volume increased which never observed earlier.
So watch out very closely in coming week.
Support =200-204
Resistance =237/276/315/354(Medium to long Target)
Subscribe to:
Comments (Atom)