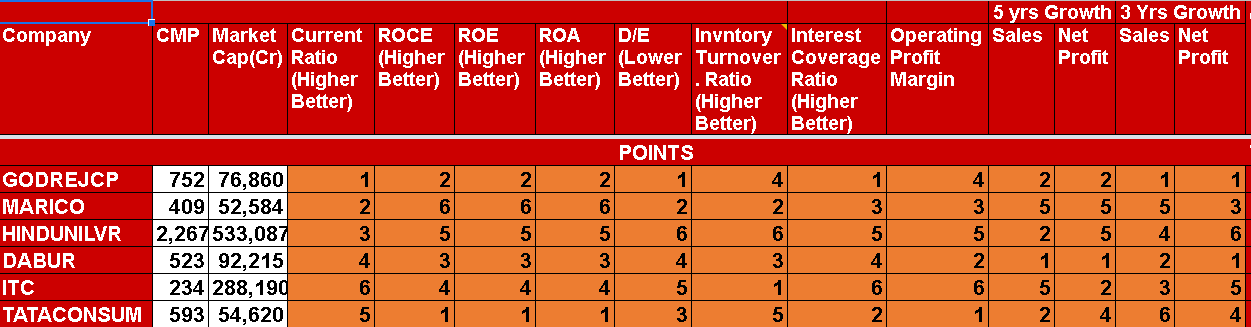
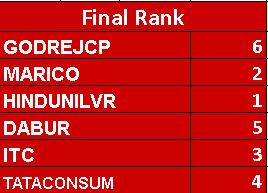
ITC has diversified product portfolio in Branded Packaged
Foods, Personal Care, Education and Stationery, Agarbattis & Safety
Matches, Lifestyle Retailing, Cigarettes & Cigars, Hotels, Paperboards
& Specialty Papers, Packaging, Agri-business & IT.
ITC seeks to be emerge as an engine of growth in the Indian
economy through a vibrant portfolio of future-ready businesses that are well
poised to serve the emerging needs of future
market. The synergies between ITC’s diverse businesses lend competitive
strength to each other. ITC aspires to be a leader in every business segment
that it operates in, whilst creating sustained value for all stakeholders.
ITC has made tremendous effort to decrease its dependence on
cigarette business. It has been successfully able to mobilise all its funds
generated from the business of Tobacco, in other fast-growing sectors like
FMCG, Agri- products, and hospitality chains.
-:Fundamental Analysis :-
-:Company Snapshot & Brand Strength :-

1) Runs 13 Business in 5 Segments.
2) Over 60 New Products launched in 1919-1920
3) ITC exports 90 Countries
4) 40 lacks farmers are involved
5) ITC’s FMCG products are available in 60
lacs retail outlets.
6) ITC’s FMCG products are available in 6
million retail outlets
7) Aashirvaad is No. 1 in branded Atta
8) Bingo! Is No. 1 in Bridges segment of Snack
Foods (No.2 overall in Snacks &
Potato
Chips)
9) Sunfeast is No. 1 in Cream Biscuits
10) Classmate is No. 1 in Notebooks
11) YiPPee! is No. 2 in Noodles.
12) Fiama is No.2 in Body Wash
13) Mangaldeep is No. 2 in Agarbattis (No. 1 in Dhoop segment)
-:Financial Health:-
-:Sales &
Profit Growth:-
- Last 10 Years Compounded Sales Growth 10%
- Last 10 Years Compounded Profit Growth 14%
- Stock is providing a good dividend yield(4.66%)
- Company has been
maintaining a healthy dividend payout
-:Free Cash Flow Trend Analysis:-
Free cash flow is the
money which has left over after it has paid for everything
it needs to continue operating—including buildings, Property, plant, equipment,
payroll, taxes, and inventory.It is also Called Owner's earnings.
Year - 2015 2016 2017 2018 2019 2020
FCF - 6543 Cr 7451 Cr 7505 Cr 10291 Cr 9414 Cr 12248 Cr
Over the last 5
years, ITC has maintained free cash flow growth has been 13.36%, vs industry average of 13.93%. This consistent growth of cash flow is very good for company as well as investors.Such cash flow indicates that company has robust potential to grow in future.
-:Liquidity Analysis:-
Over the last 5 years, ITC has maintained free cash flow
growth has been 13.36%, vs industry avg of 13.93%
Company has been maintaining a healthy dividend payout
Company is almost debt free (Debt to equity ratio-0.01)
Current Ratio-2.91 (>1.25 is Good) (A liquidity ratio that measures a company's ability to
pay short-term obligations. The higher the current ratio, the more capable the
company is of paying its obligations.)
Current Ratio-2 (>1 is Good)( The quick ratio measures a company's ability to meet its
short-term obligations with its most liquid assets. For this reason, the ratio
excludes inventories from current assets)
So Company has good Liquidity which help company to survive in adverse time also.
-:Profitability Analysis -
Company is consistently maintaining High Return Of Equity (ROE>15 Very Good) & High Return Of Capital Employed(ROCE>15% is Good) & Good ROA
-:Valuation -
- The Present Price to Earning Ratio(PE ratio) is 14.47 Which is lower than industry average 49.4
- EPS is steadily growing from Rs. 4.30 in 2011 to Rs. 12.31 in 2020
Conclusion : Analyzing all financial data, In respect of long term view ITC is a Very good investment bet & as per my view every investor must consider to include this dark horse in Portfolio.
Technical View
CMP of ITC is Rs. 217.85. ITC Recovers from March low low Rs.135 slowly following the uptrend Channel drawn red line.Now last 6 session price consolidate between Rs.200-220 & preparing to break out the channel.
The One interesting observation to be noted that Price mostly respects magic lines of green channel of 89 Moving Average, from very beginning of up journey .
In chart, 3 red arrows indicates efficient resistance by channel, 5 blue arrow shows good support zone.
In middle of June '2016 , green arrow shows that after breakout of green channel ,price steadily up move.
Now again that similar situation is arising if price able to cross the green channel & price sustain above Rs.225,don't miss the opportunity to buy for multibagger return .
Another notable observation is that from January'20 , significant volume increased which never observed earlier.
So watch out very closely in coming week.
Support =200-204
Resistance =237/276/315/354(Medium to long Target)